Team title: Global Solar Magnetic Field Maps
Team ID: S2-03
Team Leads:
Carl Henney (Air Force Research Laboratory (AFRL), USA), cjhenney@gmail.com
Nick Arge (NASA GSFC, USA), charles.n.arge@nasa.gov
Keywords (impact): Solar Wind, CME Propagation, Coronal Holes, Navigation/Communication
Keywords (activity type): Modeling, Forecasting, Community Scoreboard, Data Utilization
Introduction:
The Global Solar Magnetic Field Working Team will address the key challenges and limitations of creating global solar magnetic field maps. In preparation of Solar Orbiter PHI magnetograph data, the team will compare different map generation techniques and different input data sources (e.g., NSO/GONG, SDO/HMI, and SO/PHI), along with how best to combine differing methods and data sources (i.e., vector and LOS, along with different instruments) to improve estimates of the global radial magnetic field distribution. As the solar community continues to generate new and different global maps, there is an increased need to find methods to compare available maps, e.g., with modeled solar wind parameters, coronal hole boundaries, and/or coronal topology.
Discussion:
- How best to compare the potpourri of community global magnetic maps?
- How best to represent differences between global maps to inform coronal modelers?
- How best to create a community ensemble of global maps?
Objectives:
- Prototype a real-time comparison "Scoreboard" of publicly available global maps
- Identify meta-data requirements of coronal and solar wind models
- How best to specify uncertainties within a global map (pixel-by-pixel)?
- Identify potential parameters/metrics for comparison "Scoreboard" between global maps, e.g.:
- polar mean, global mean, histograms of flux distribution
- track individual map spatial differences relative to a mean map
- current sheet location (i.e., using identical coronal model)
- modeled coronal hole boundaries compared with observations
- Identify periods for detailed comparisons (e.g., WHPI Campaign - PSP-P04)
- Identify requirements for participation (e.g., file format & meta-data for coronal models
- Identify framework to produce a daily comparison scoreboard (e.g., CCMC and WHPI)
Clusters with overlapping topics: G1, G2a, G2b, H1, H2, H3, O1, O2, O3, S1, S2, S3
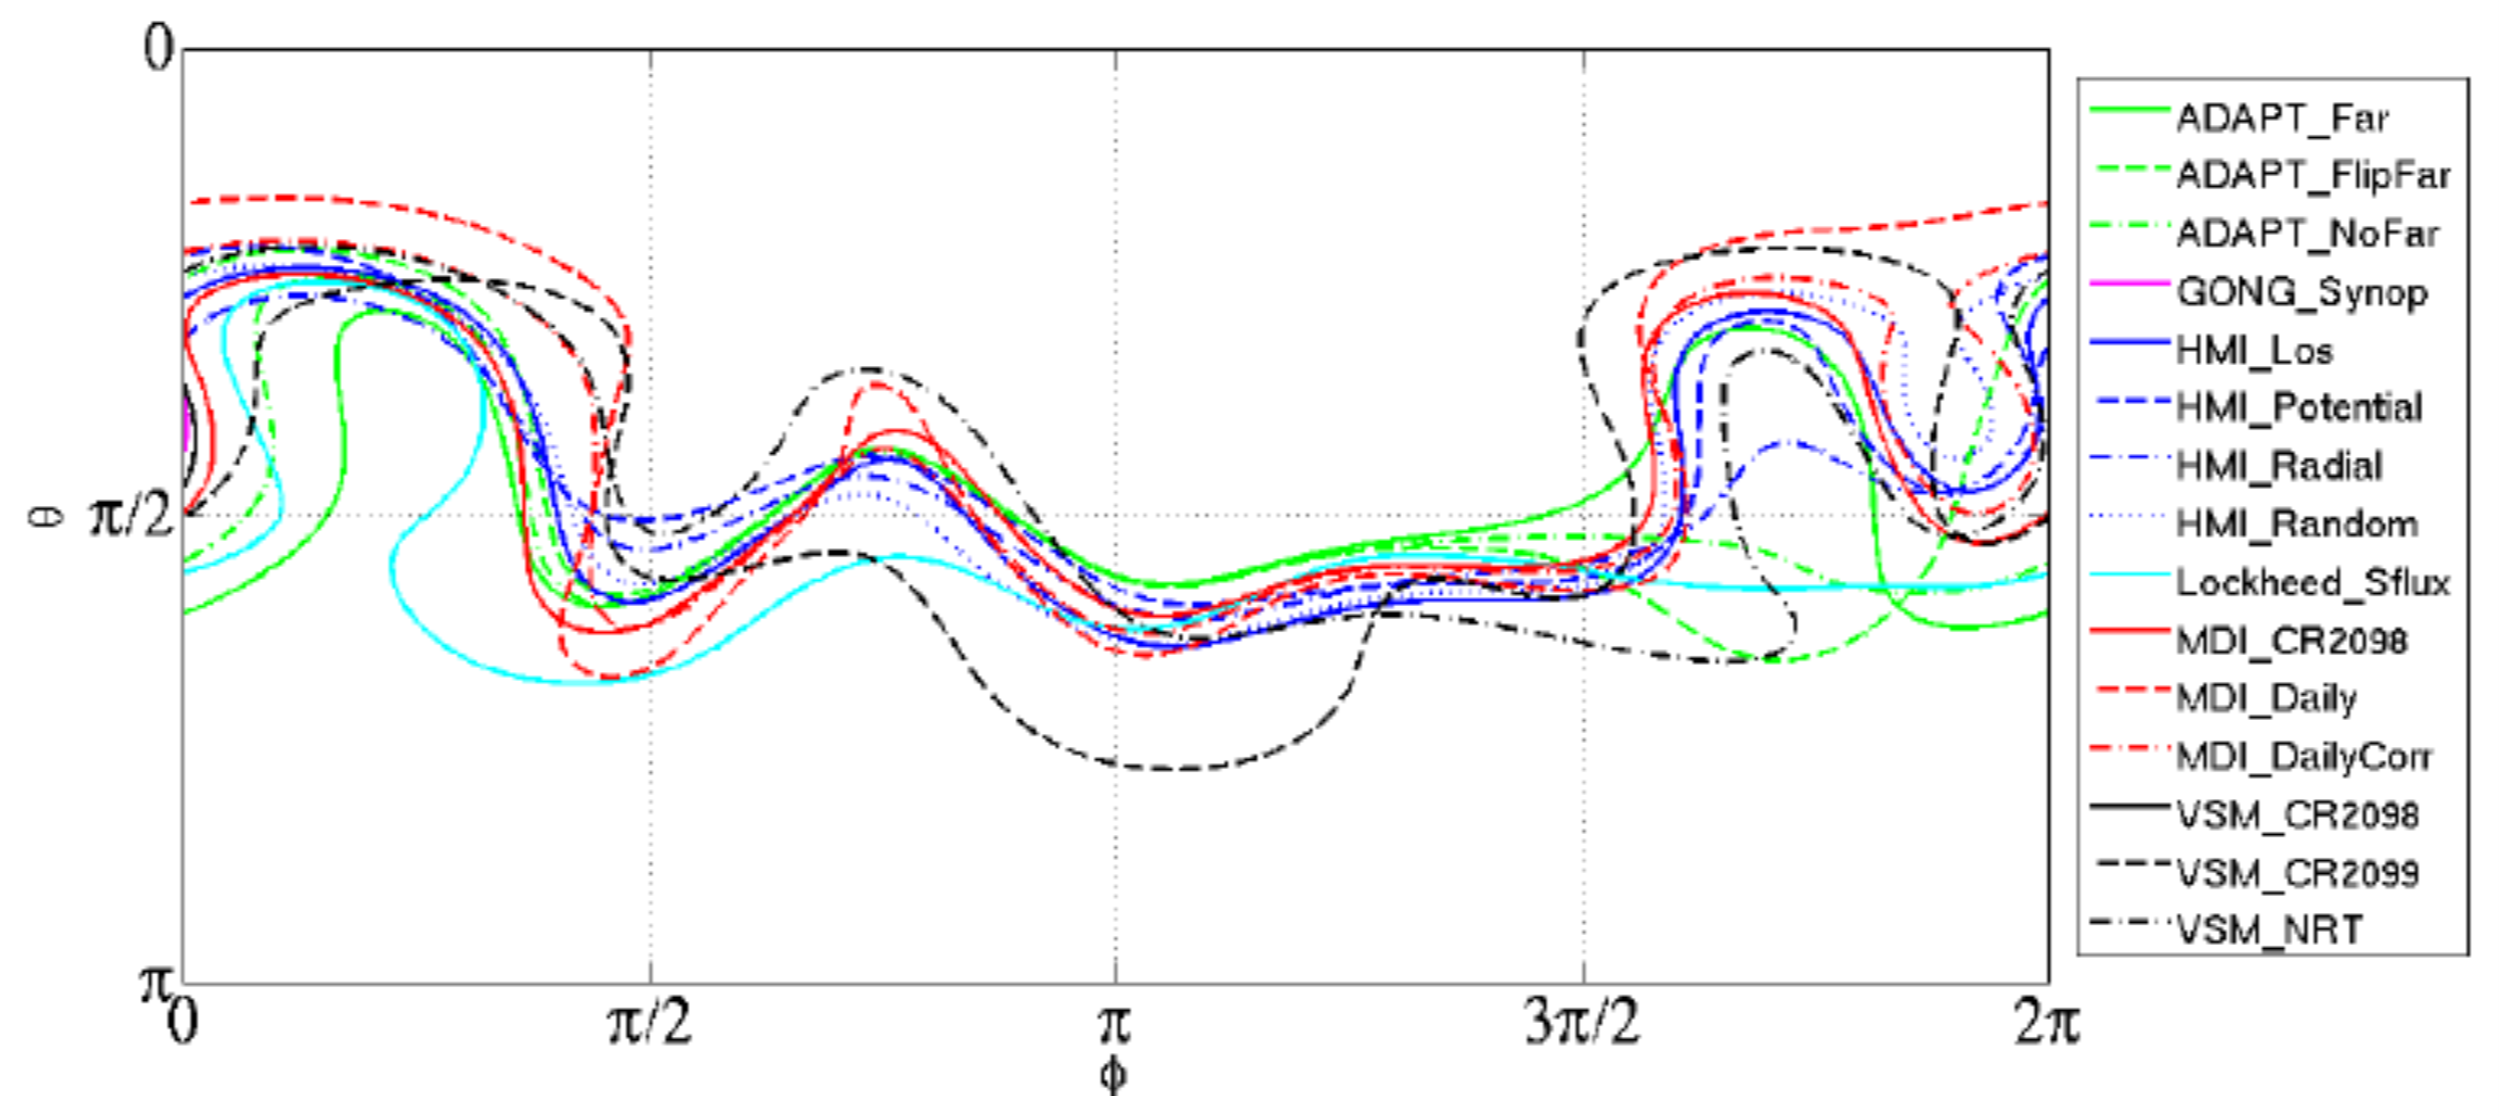
The image below illustrates a potential dashboard metric (in this case, the current sheet location using the same model) for real-time global map comparisons. The example is a current sheet comparison by Linker et al. for the challenge map results during SHINE 2016.